The tale of Trace Compass and the Generic Callstack
The old
Once upon a time in Trace Compass, there was a callstack analysis. It was lying there in the core, all by herself. Sure it was implemented by LTTng-UST cyg-profile tracing. Actually, it was made with LTTng-UST cyg-profile in mind. And for years, they’ve been playing together, a lone use case of callstack.
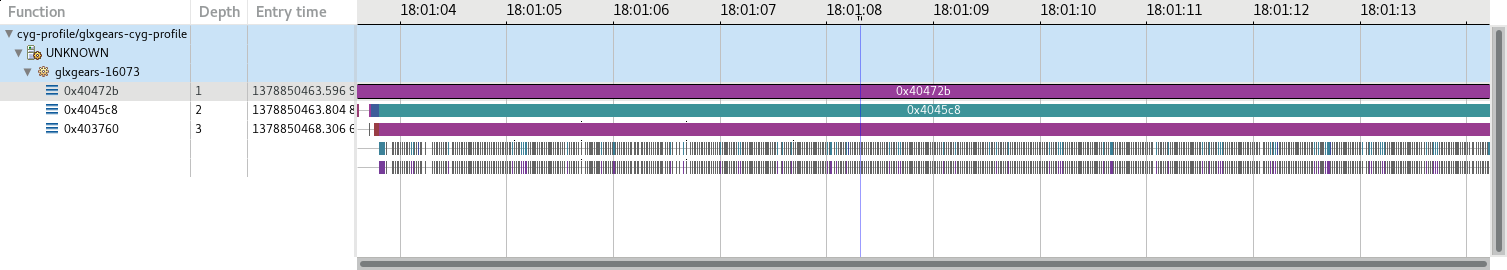
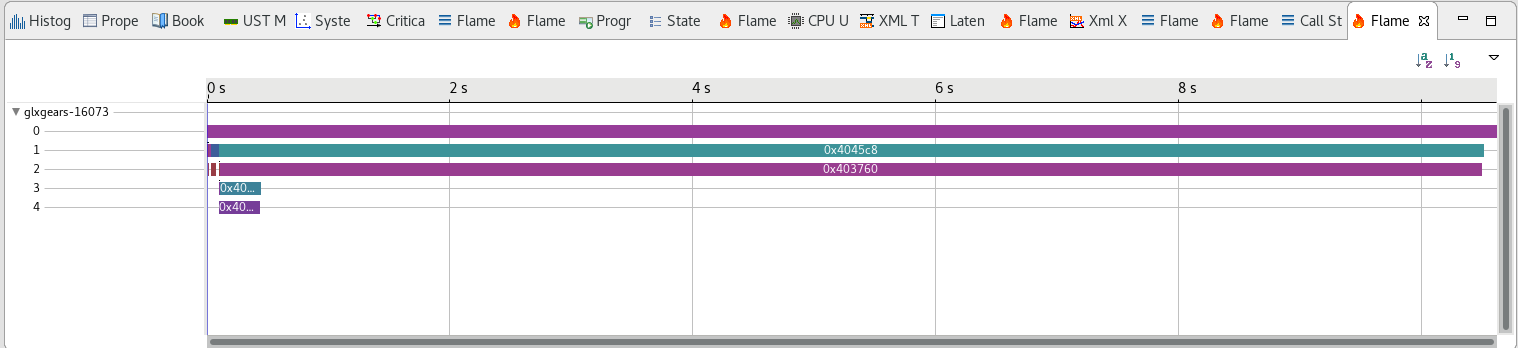
Then came the new hipster kid on the block: flamegraphs! Flame graphs are fun, they aggregate statistics to give high level view of where time is spent in a system, per thread, per process, all together. It would iterate over the callstack, any callstack, and calculate statistics as it goes. And with those statistics, many other statistics charts could be drawn. Flamegraphs and callstacks together came to be very powerful tools to understand the insides of an application. But still, only one implementation: LTTng-UST cyg-profile…
Adding implementations meant writing a Java class for the analysis, a Java class to tell the analysis how to get the process ID (to resolve symbols if necessary), thread ID (to well separate the stacks) and whether an event is a function entry or exit.
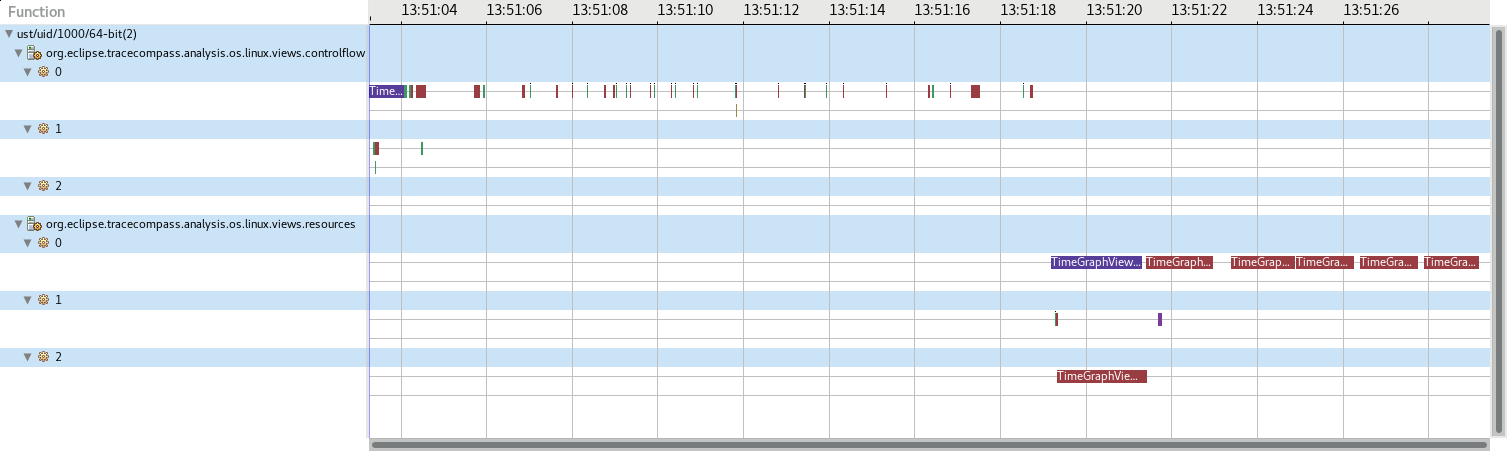
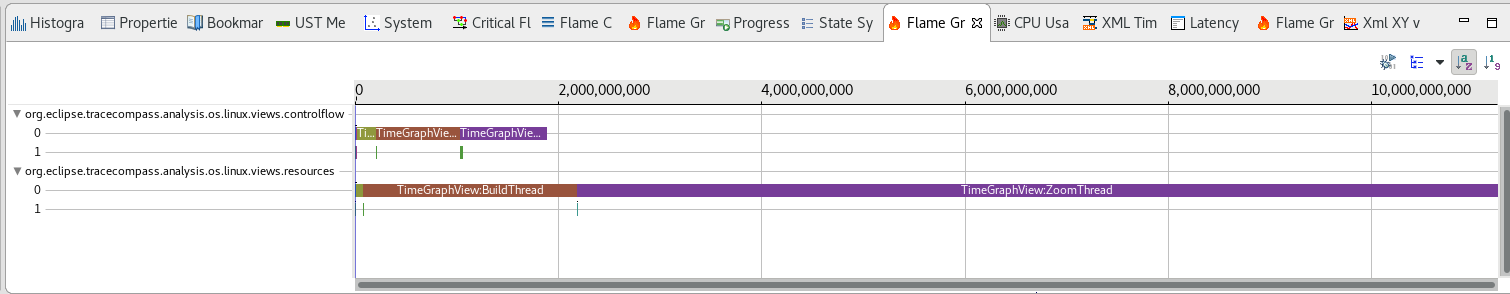
But not all analyses fit in that mold. Maybe the thread ID is not that important for some use cases. A trace of Trace Compass itself would typically show a lot of short-lived threads whenever some operation is requested, like a zoom on a view or the execution of an analysis. It would be much more interesting to group the callstack by application component, like a specific view, and see all the stacks associated with it underneath.
And the new
Then came the Incubator for Trace Compass, a project to test and develop new features. That’s where the callstack, flamegraphs and additional statistics were copied and there they started a life of their own, under the name of Generic Callstack. Of course they had to remain compatible with their old self so anything extending that outside Trace Compass would be easy to migrate.
First, the process/thread structure of the callstacks was replaced by a set of group descriptors to describe each group and there can be as many or as few groups as needed and they can represent anything. When building the callstack, the analyses can leave the process and thread IDs somewhere in one of those groups or at the callstack level, to be used later for statistics and visualization, or not, if that information is not available.
Second, the whole analysis was made compatible for either instrumented or profiled application. The Callstack View was renamed Flame Chart View and is only available to instrumented applications, while the Flame Graph View is available for both.
Now any application that has been instrumented and traced in such a way that one can know when something (anything!) begins or ends can now join the party. And no java codes needs to be written at all! It can all be data-driven!
- “So who wants to start?”, cries out Miss Callstack/Flamegraph (Miss CF for short) to all the traces gathered around her.
- “Pick me! Pick me!”, says the JUL trace taken from Trace Compass, using LTTng agent.
- “Ok, you represent a Java application, so let’s see your events”
And here comes the JUL trace showing off her events:
[13:51:24.915518124] (+0.000082431) wilbrod lttng_jul:event: { cpu_id = 7 }, { msg = "{\"ts\":626616136958,\"ph\":\"s\",\"tid\":159,\"name\":\"TimeGraphView:ZoomThread\",\"cat\":\"org.eclipse.tracecompass.analysis.os.linux.views.resources\",\"id\":\"0x74\",\"args\":{\"start\":1457113582904894720,\"end\":1457113583116899328}}", logger_name = "org.eclipse.tracecompass.tmf.ui.views.timegraph.AbstractTimeGraphView", class_name = "", method_name = "", long_millis = 1504633884915, int_loglevel = 500, int_threadid = 159 }
[13:51:26.249171034] (+1.333652910) wilbrod lttng_jul:event: { cpu_id = 3 }, { msg = "{\"ts\":627949767960,\"ph\":\"s\",\"tid\":159,\"name\":\"RefreshRequested\",\"cat\":\"org.eclipse.tracecompass.analysis.os.linux.views.resources\",\"id\":\"0x75\"}", logger_name = "org.eclipse.tracecompass.tmf.ui.views.timegraph.AbstractTimeGraphView", class_name = "", method_name = "", long_millis = 1504633886249, int_loglevel = 500, int_threadid = 159 }
[13:51:26.249355098] (+0.000184064) wilbrod lttng_jul:event: { cpu_id = 3 }, { msg = "{\"ts\":627949931143,\"ph\":\"f\",\"tid\":159,\"cat\":\"org.eclipse.tracecompass.analysis.os.linux.views.resources\",\"id\":\"0x75\"}", logger_name = "org.eclipse.tracecompass.tmf.ui.views.timegraph.AbstractTimeGraphView", class_name = "", method_name = "", long_millis = 1504633886249, int_loglevel = 500, int_threadid = 159 }
[13:51:26.249501757] (+0.000146659) wilbrod lttng_jul:event: { cpu_id = 3 }, { msg = "{\"ts\":627950137553,\"ph\":\"f\",\"tid\":159,\"cat\":\"org.eclipse.tracecompass.analysis.os.linux.views.resources\",\"id\":\"0x74\"}", logger_name = "org.eclipse.tracecompass.tmf.ui.views.timegraph.AbstractTimeGraphView", class_name = "", method_name = "", long_millis = 1504633886249, int_loglevel = 500, int_threadid = 159 }
There’s a msg string in there that looks a lot like the json string of the trace-event format with the flow events. Let’s focus on them for now, to build the callstack for only those flow events.
- “So JUL, how would you like your events to be shown?”, asks Miss CF.
- “I was taken with the intent of analysing the performances of the view, so I guess if my threads could be grouped by the view requesting them, that would be awesome, the view ID is in the field named cat”, answers the trace
- “Great! So let’s fill the backend of our callstack with that data”
So Miss CF starts writing an XML pattern analysis for the s and f events of the trace. The following excerpt is from that analysis:
<pattern version="1" id="org.eclipse.tracecompass.incubator.example.tracecompass.grouped.threads.pattern">
    <head>
        <traceType id="org.eclipse.tracecompass.incubator.tracecompass.trace.jul" />
        <label value="Example: Per component callstack" />
    </head>
    <location id="CurrentThread">
        <stateAttribute type="constant" value="Views" />
        <stateAttribute type="query">
            <stateAttribute type="constant" value="#CurrentScenario" />
            <stateAttribute type="constant" value="component" />
        </stateAttribute>
        <stateAttribute type="constant" value="Component" />
        <stateAttribute type="pool" />
    </location>

    <patternHandler>

        <!-- CONDITIONS -->
        <!-- Test if the current running thread is equal to the current scenario thread -->
        <test id="thread_thread">
            <if>
                <condition>
                    <stateValue type="eventField" value="int_threadid" forcedType="int" />
                    <stateValue type="query">
                        <stateAttribute type="constant" value="#CurrentScenario" />
                        <stateAttribute type="constant" value="threadID" />
                    </stateValue>
                </condition>
            </if>
        </test>
        <test id="is_start">
            <if>
                <condition>
                    <stateValue type="eventField" value="ph" />
                    <stateValue type="string" value="s" />
                </condition>
            </if>
        </test>
        <test id="is_end">
            <if>
                <condition>
                    <stateValue type="eventField" value="ph" />
                    <stateValue type="string" value="f" />
                </condition>
            </if>
        </test>
        <test id="last_out">
            <if>
                <condition>
                    <stateValue type="query">
                        <stateAttribute type="location" value="CurrentThread" />
                        <stateAttribute type="constant" value="CallStack" />
                    </stateValue>
                    <stateValue type="int" value="1" />
                </condition>
            </if>
        </test>

        <!-- ACTIONS -->

        <!-- Actions and test for time graph view threads -->
        <action id="entering_thread">
            <!-- Initialize current scenario data: component, thread -->
            <stateChange>
                <stateAttribute type="constant" value="#CurrentScenario" />
                <stateAttribute type="constant" value="threadID" />
                <stateValue type="eventField" value="int_threadid" forcedType="int" />
            </stateChange>
            <stateChange>
                <stateAttribute type="constant" value="#CurrentScenario" />
                <stateAttribute type="constant" value="component" />
                <stateValue type="eventField" value="cat" />
            </stateChange>
        </action>
        <action id="push_event_type">
            <!-- Push the current event to the thread's callstack -->
            <stateChange>
                <stateAttribute type="location" value="CurrentThread" />
                <stateAttribute type="constant" value="CallStack" />
                <stateValue type="eventField" value="evName" stack="push" />
            </stateChange>
        </action>
        <action id="pop_event_type">
            <!-- Pop the current event from the callstack -->
            <stateChange>
                <stateAttribute type="location" value="CurrentThread" />
                <stateAttribute type="constant" value="CallStack" />
                <stateValue type="eventField" value="evName" stack="pop" />
            </stateChange>
        </action>

        <!-- FSM -->
        <fsm id="tgThread" initial="Wait_thread_start">
            <state id="Wait_thread_start">
                <!-- The state will stay here until we have a thread start event -->
                <transition event="*" cond="is_start" target="in_thread" action="entering_thread:push_event_type" />
            </state>
            <state id="in_thread">
                <!-- The state will loop on itself until the last function exit -->
                <transition event="*" cond="thread_thread:is_start" target="in_thread" action="push_event_type" />
                <transition event="*" cond="thread_thread:is_end:last_out" target="end_thread" action="pop_event_type" />
                <transition event="*" cond="thread_thread:is_end" target="in_thread" action="pop_event_type" />
            </state>
            <final id="end_thread" />
        </fsm>
    </patternHandler>
</pattern>
What is notable in this XML is that a scenario starts from the first s event entry from a thread, until the last event of that thread’s stack is popped. So at the first event of the scenario, the entering_thread action sets the tid of the current thread and subsequent events will be part of this scenario only if they are from the same thread.
Also, in the location defined at the beginning of the pattern, the attribute of type pool means a different callstack will be used for each scenario under the Component. And as scenarios terminate, the callstack will be re-used for subsequent scenarios.
Last, notice in the push_event_type and pop_event_type actions, that the values are pushed and popped under a CallStack attribute. For now, that name is important and all last level stack should be stored under that name.
- “But that’s a plain old XML pattern!”, interrupts the JUL trace
- “Yes of course! As any java callstack is built using a plain old backend. Now let’s turn that backend into a callstack with a few additional XML lines”
And that’s how with a few additional lines, a new analysis is born, only in XML.
<callstack id="org.eclipse.tracecompass.incubator.example.tracecompass.grouped.threads">
    <callstackGroup name="Example: Per component callstack">
        <level path="Views/*" />
        <level path="Component/*" />
    </callstackGroup>

    ... The pattern XML code ...
</callstack>
And then Miss CF showed screenshots of the result to a cheering audience.
And all the traces left the party afterwards, wondering how they could take advantage of this new feature, promising Miss CF to come back for more such demonstrations.
And Miss CF cleaned the place, wondering what else she could do to give a more interesting show to the traces next time they join her for a party. I have a feeling this is not the last we hear of Miss CF…
To reproduce
To reproduce the example in this article, one needs the Generic Callstack feature from the incubator. The full XML file can be found here. To test with an actual trace, the Trace Compass JUL traces feature must be installed and a trace can be found in this archive. The trace is in the ust/ folder and its type may need to be set in Trace Compass, by right-click Select trace type… -> Common Trace Format -> LTTng JUL Trace.